TL;DR:
- Focused, automated metrics tied to growth drive better decisions than countless dashboards.
- Key SaaS metrics include MRR, ARR, churn, CAC, LTV, and NRR for accurate business health insights.
- Structured reporting frameworks and regular reviews enhance decision speed and operational clarity.
Most SaaS founders believe that more dashboards equal better decisions. They don’t. Stacking up reports without a clear framework just creates noise, and noise slows you down. The real edge comes from focused, automated reporting tied directly to the metrics that drive growth. SaaS reporting means tracking the numbers that matter, like MRR, ARR, churn, CAC, LTV, and NRR, so every financial call is grounded in data, not gut feel. This guide breaks down the core metrics, the frameworks that make reporting reliable, and the real operational gains you can expect when you get this right.
Table of Contents
- Why reporting is critical in SaaS growth
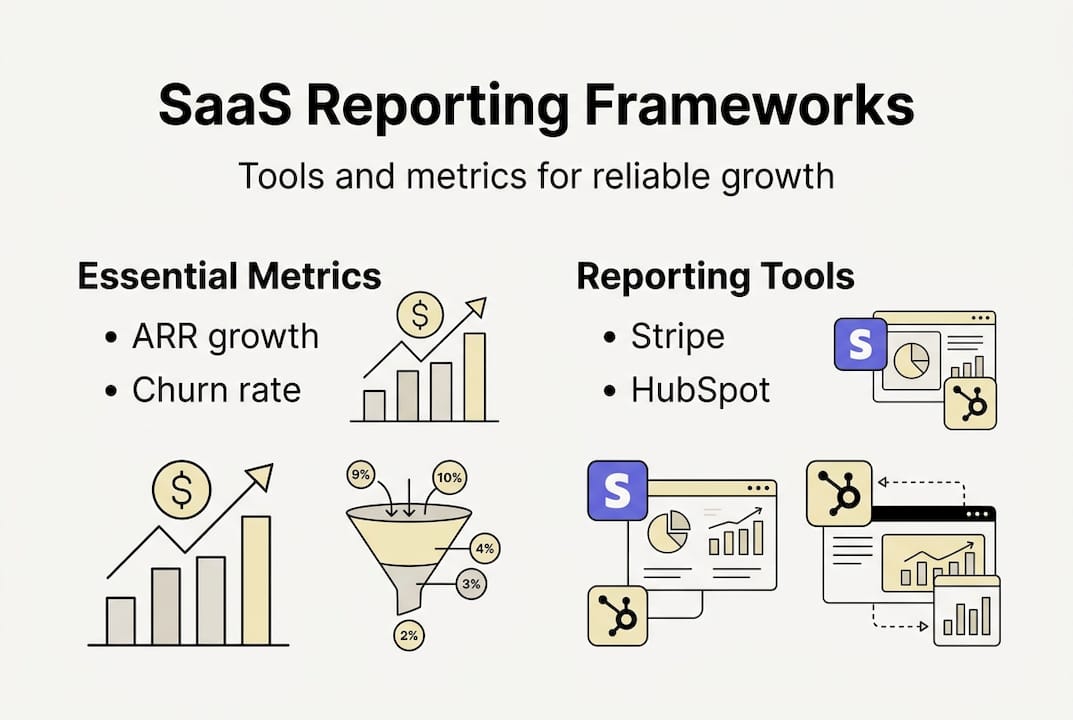
- The essential metrics every SaaS leader must track
- Frameworks and tools for reliable SaaS reporting
- From numbers to action: how reporting transforms SaaS performance
- The uncomfortable truth most SaaS teams miss about reporting
- Connect reporting to real growth with the right SaaS tools
- Frequently asked questions
Key Takeaways
| Point | Details |
|---|---|
| Focus on actionable metrics | Tracking the right financial KPIs drives smarter, data-backed SaaS decisions. |
| Leverage automation | Automated reporting slashes errors and unlocks faster, real-time insights. |
| Use proven frameworks | Stepwise reporting processes and integrated dashboards boost consistency and impact. |
| Benchmark for improvement | Comparing your SaaS metrics to industry standards helps spot growth opportunities. |
| Simplify for scale | Focusing on the metrics that matter prevents overwhelm and leads to lasting operational efficiency. |
Why reporting is critical in SaaS growth
Reporting in SaaS is not just about pulling numbers from your billing tool once a month. It is about creating a live, structured view of your business so you can make faster, smarter calls at every stage of growth. That distinction matters because SaaS revenue is fundamentally different from traditional software sales. You are dealing with recurring revenue, subscription churn, expansion MRR, and customer lifetime value, all of which shift constantly and require ongoing visibility.
For executives, SaaS reporting enables data-driven financial decisions and operational improvements that compound over time. When your reporting is tight, you can spot a churn spike before it becomes a revenue crisis. You can see when your CAC is creeping up before it eats your margins. That kind of transparency also builds investor confidence, because clean, consistent reporting signals that you run a disciplined operation.
Three core drivers make reporting a genuine growth lever:
- Transparency: Investors, board members, and leadership teams all need a shared view of the business. Reporting creates that shared language.
- Operational clarity: When every team lead can see the numbers relevant to their function, decisions happen faster and with less back-and-forth.
- Accountability: Metrics tied to goals create ownership. Teams move differently when they know the numbers are tracked weekly, not quarterly.
“The companies that scale fastest are not the ones with the most data. They are the ones who act on the right data, consistently.”
The biggest pitfall here is vanity metrics. Pageviews, total signups, and raw user counts feel good to report but tell you almost nothing about financial health. Focus instead on tracking SaaS metrics that connect directly to revenue, retention, and efficiency.
Pro Tip: Build your reporting cadence around the decisions you need to make weekly, not around what your tools make easy to export.
The essential metrics every SaaS leader must track
With the why in place, let’s drill into the concrete metrics that move the needle for SaaS companies. Not all metrics are created equal, and the ones you prioritize should shift as your business matures.
Here are the six metrics every SaaS leader needs to understand:
- MRR (Monthly Recurring Revenue): The predictable revenue your business generates each month. It is your baseline for everything else.
- ARR (Annual Recurring Revenue): MRR multiplied by 12. Used for investor reporting, valuation, and annual planning.
- Churn Rate: The percentage of customers or revenue lost in a given period. High churn erodes growth faster than most founders expect.
- CAC (Customer Acquisition Cost): Total sales and marketing spend divided by new customers acquired. Tells you how expensive growth is.
- LTV (Lifetime Value): The total revenue you expect from a customer over their relationship with you. Paired with CAC, it reveals unit economics.
- NRR (Net Revenue Retention): Revenue retained from existing customers after churn and expansion. An NRR above 100% means your existing base is growing on its own.
| Metric | What it measures | 2025 benchmark |
|---|---|---|
| ARR growth | Year-over-year revenue expansion | 19-21% median |
| NRR | Retention and expansion from existing customers | 100-105% |
| CAC payback | Months to recover acquisition cost | 20 months |
| LTV:CAC ratio | Efficiency of growth spend | 3.6:1 |
| Gross margin | Revenue minus cost of goods sold | 77-81% |
At early stages, focus on MRR growth and churn. At the growth stage, shift attention to CAC payback and NRR. At maturity, gross margin and ARR growth drive valuation conversations. You can find a detailed breakdown of SaaS metrics by lifecycle to match your current stage.

NRR and CAC payback are particularly powerful for valuation. Investors use NRR to gauge product stickiness and expansion potential. A strong SaaS metrics guide will show you that companies with NRR above 120% command significant valuation premiums.
Pro Tip: Limit your executive dashboard to six to eight metrics maximum. More than that and focus disappears. Proper error reduction with reporting starts with simplifying what you track.
Frameworks and tools for reliable SaaS reporting
Knowing which metrics count is only half the battle, so let’s explore how to reliably report on them without drowning in spreadsheets. A structured framework is what separates companies that act on data from those that just collect it.
Here is a proven seven-step framework for setting up reliable SaaS reporting:
- Define your reporting goals. What decisions will this data support? Start there.
- Integrate your data sources. Connect your CRM, billing platform, and product analytics into a single pipeline.
- Standardize metric definitions. Make sure MRR means the same thing to finance, sales, and product.
- Build role-specific dashboards. Executives need high-level views. Operators need drill-down capability.
- Apply cohort analysis. Group customers by acquisition date to track behavior over time and spot retention patterns.
- Use W-shaped attribution. Understand which touchpoints actually drive conversions, not just the first or last click.
- Schedule weekly reviews. Transparent B2B SaaS reporting works best when reviews are consistent, not ad hoc.
| Reporting approach | Error rate | Decision speed | Scalability |
|---|---|---|---|
| Manual spreadsheets | High | Slow | Poor |
| Integrated dashboards | Low | Fast | Strong |
| Automated pipelines | Very low | Real-time | Excellent |
For small to mid-sized SaaS companies, the right stack usually includes a billing tool like Stripe or Chargebee, a CRM like HubSpot or Salesforce, and a dashboard layer like Looker or Chartio. The SaaS reporting guide from Pipedrive offers a solid overview of tool combinations that work at different scales.
Building out your step-by-step reporting process takes upfront effort, but the payoff is consistency. And when you are ready to visualize it all, building SaaS dashboards that your whole leadership team can read at a glance is the next logical move.
Pro Tip: Schedule a quarterly data quality audit. Check that your metric definitions have not drifted and that integrations are still pulling clean data. Small data errors compound fast.
From numbers to action: how reporting transforms SaaS performance
Once the right tools and frameworks are in play, the benefits become clear. Here is how best-in-class reporting changes the game for SaaS teams.
The most immediate gain is speed. When your data is automated and centralized, you are not waiting three days for a finance analyst to pull a report. You see the numbers in real time and act on them the same day. That speed compounds over quarters.
Reporting also surfaces inefficiencies that would otherwise stay hidden. Here are the most common ones that accurate reporting helps you catch early:
- Underperforming customer segments that consume support resources without expanding revenue
- High CAC channels where spend is not converting to retained customers
- Churn clusters concentrated in specific cohorts, pricing tiers, or onboarding paths
- Billing errors that quietly leak MRR month after month
- Overprovisioned tools and vendor contracts that no longer match actual usage
“Automation reduces errors by 20% and enables real-time decisions that prevent costly quarterly surprises.”
The financial impact is real. Case studies show that SaaS companies using optimized reporting and spend analysis cut costs by 30 to 35%. That is not a rounding error. That is capital you can redirect to product, hiring, or runway extension.
The shift from quarterly surprises to weekly course corrections is where reporting pays its biggest dividend. When you catch a churn trend in week two of the quarter, you still have time to respond. Waiting until the board meeting means you are explaining a problem, not solving one. Pairing your reporting with automation for SaaS is what makes that responsiveness sustainable at scale. And when leadership can pull up financial dashboards on demand, the entire organization moves with more confidence.
The uncomfortable truth most SaaS teams miss about reporting
Here is what most reporting guides will not tell you: the tools are rarely the problem. Most SaaS teams have access to perfectly good dashboards. The real issue is that those dashboards are never reviewed in a structured, decision-focused way. Reports become shelfware when they are not tied to a weekly executive ritual where someone is accountable for acting on what the numbers say.
Vanity metrics thrive not because founders are naive, but because they are emotionally easier to report. Total users going up feels good. NRR dropping feels uncomfortable. The discipline is in building a culture where the uncomfortable number gets the most airtime.
We have also seen founders over-engineer their reporting stack, adding more tools and more metrics, thinking complexity signals sophistication. It does not. Simple, automated dashboards reviewed consistently beat overloaded Excel files reviewed occasionally every single time.
The contrarian move is to cut your metric count in half and double your review frequency. Fewer metrics, updated more often, tied to clear owners. That is where reporting actually drives change. Grounding this in SaaS finance best practices gives you the structure to make it stick.
Connect reporting to real growth with the right SaaS tools
If you are ready to put these lessons into action, here are resources and tools to help your SaaS scale with clarity.
Meticq is built specifically for SaaS founders who want CFO-level financial clarity without the full-time overhead. From tracking the SaaS metrics that matter most at each growth stage to setting up financial dashboards for SaaS that your whole team can act on, Meticq turns reporting from a chore into a competitive advantage. You can also explore practical bookkeeping tips for SaaS to make sure your underlying data is clean before you build on top of it. Better reporting starts with the right foundation, and we help you build it.
Frequently asked questions
What are the key financial metrics SaaS companies should track?
Core SaaS metrics include MRR, ARR, Churn, CAC, LTV, and NRR, giving you a complete view of revenue health, growth efficiency, and customer retention in one framework.
How does automated reporting improve SaaS efficiency?
Automation reduces errors by 20% and enables real-time decision-making, so your leadership team can respond to trends in days rather than weeks.
Which reporting tools are best for small SaaS businesses?
Integrated dashboards connected to your CRM and billing platform give you the accuracy and scalability that manual spreadsheets simply cannot match.
What benchmarks help SaaS executives assess performance?
Median benchmarks for 2025 show ARR growth of 19 to 21%, NRR of 100 to 105%, CAC payback of 20 months, and an LTV:CAC ratio of 3.6:1, giving you a clear baseline to measure against.