TL;DR:
- Most growth-stage SaaS companies face a median CAC payback period of 20 months, signaling economic strain.
- Key metrics like LTV:CAC and NRR are essential for sustainable growth and should be monitored weekly.
- AI-first SaaS models have lower gross margins and longer payback periods, requiring adjusted benchmarks.
Scaling a SaaS company feels like progress until your unit economics tell a different story. The median CAC payback period has worsened to 20 months for growth-stage companies, up from benchmarks that once felt manageable. That means you’re waiting nearly two years to recover what you spent acquiring each customer. For founders and executives navigating growth, this isn’t just a finance problem. It’s a strategic one. This guide breaks down the core metrics, current benchmarks, and practical steps to build economics that actually support sustainable scale.
Table of Contents
- Defining SaaS unit economics: fundamentals and formulas
- Core SaaS unit economics metrics and real-world benchmarks
- Nuances for AI-driven and outcome-based SaaS models
- Applying unit economics: optimizing for growth and retention
- The uncomfortable truth about SaaS unit economics
- Build smarter SaaS economics with Meticq
- Frequently asked questions
Key Takeaways
| Point | Details |
|---|---|
| Master core metrics | Understanding CAC, payback, and NRR improves SaaS growth decisions. |
| Benchmarks matter | Current benchmarks show payback periods lengthening in growth-stage SaaS, requiring careful strategy. |
| AI changes economics | AI-first SaaS models demand new margin targets and pricing strategies for profitability. |
| Expansion over acquisition | Prioritizing NRR and organic growth channels leads to healthier unit economics. |
Defining SaaS unit economics: fundamentals and formulas
Unit economics answer one fundamental question: does your business make money on each customer, and how long does it take? In SaaS, this question is more nuanced than in traditional businesses because revenue is recurring, costs are front-loaded, and customer relationships compound over time.
Unlike a product business where you sell once and move on, SaaS economics play out over months or years. A customer who churns at month three is a very different financial outcome than one who stays for three years and expands. That’s why measuring SaaS metrics requires a different lens entirely.
The core metrics you need to know:
- ARPU (Average Revenue Per User): Total MRR divided by total customers. Your baseline revenue signal.
- CAC (Customer Acquisition Cost): Total sales and marketing spend divided by new customers acquired in a period.
- Gross Margin: Revenue minus cost of goods sold (COGS), expressed as a percentage. In SaaS, COGS includes hosting, support, and infrastructure.
- LTV (Lifetime Value): ARPU multiplied by gross margin, divided by churn rate. Represents total profit from one customer.
- LTV:CAC Ratio: LTV divided by CAC. A ratio of 3:1 or higher is the standard target.
- Payback Period: CAC divided by (ARPU multiplied by Gross Margin). This tells you how long until a customer becomes profitable.
The unit economics formula for payback period is straightforward: target under 12 months for early-stage companies and under 18 months for growth-stage. Most growth-stage companies are currently sitting at 20 months, which signals a real pressure point.
| Metric | Early-stage target | Growth-stage target |
|---|---|---|
| CAC Payback | Under 12 months | Under 18 months |
| LTV:CAC | 3:1 or higher | 3.5:1 or higher |
| Gross Margin | 65%+ | 70%+ |
| NRR | 100%+ | 110%+ |
Understanding CAC benchmarks in context matters as much as knowing the formulas. A 20-month payback isn’t automatically fatal, but it demands that your gross margin and NRR are strong enough to compensate.
Core SaaS unit economics metrics and real-world benchmarks
Knowing the formulas is the starting point. Knowing what good looks like in 2026 is where strategy begins.
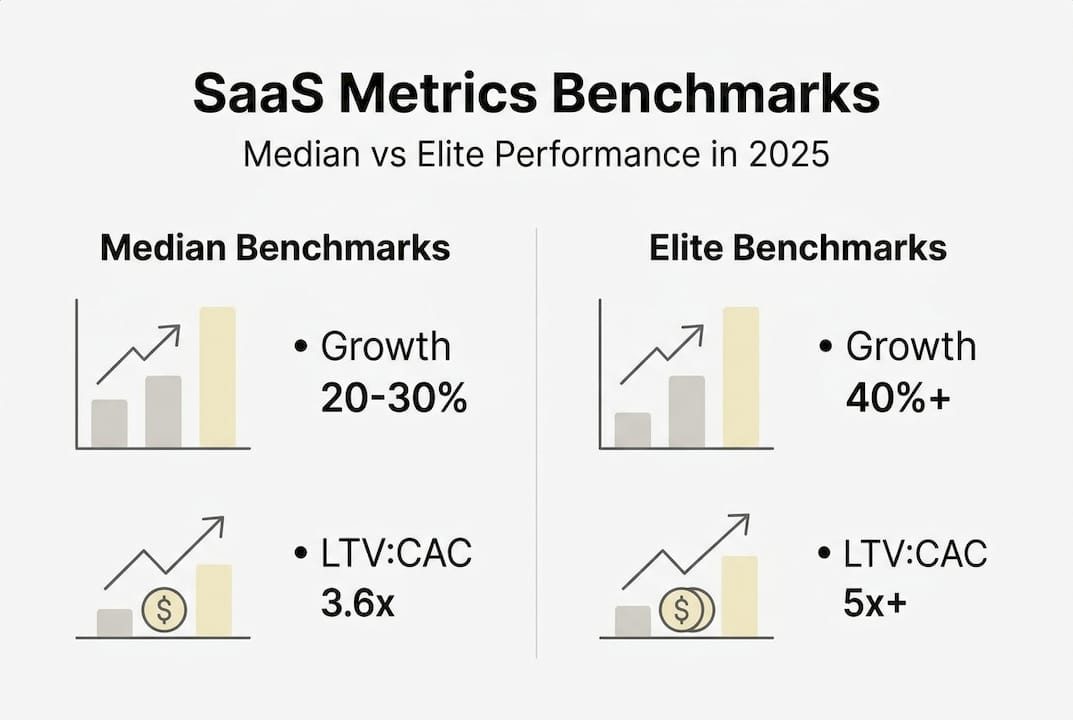
According to 2025 B2B SaaS benchmarks, the median growth rate sits between 20 and 30%, with a sales and marketing multiple of 3.2x and salary spend consuming around 67% of revenue. LTV:CAC for healthy companies averages 3.6x, payback sits at 20 months, and elite companies maintain NRR above 100%.
| Metric | Median benchmark | Elite benchmark |
|---|---|---|
| Revenue growth | 20-30% | 40%+ |
| LTV:CAC | 3.6x | 5x+ |
| CAC Payback | 20 months | Under 12 months |
| NRR | 95-100% | 110%+ |
| Gross Margin | 70-75% | 80%+ |
These numbers tell a clear story. Most growth-stage companies are operating close to the edge on payback, which means retention and expansion are no longer optional levers. They’re survival mechanisms.
Here’s how to monitor each metric consistently:
- CAC: Calculate monthly by dividing total S&M spend by new logos. Track by channel to identify where acquisition efficiency is eroding.
- LTV:CAC: Review quarterly. A declining ratio signals either rising acquisition costs or shrinking customer value.
- Gross Margin: Monitor monthly. Any infrastructure or support cost creep will show up here first.
- NRR: Track monthly. This is your clearest signal of product-market fit and customer health.
- Payback Period: Review quarterly alongside CAC. If it’s lengthening, investigate whether it’s a pricing, cost, or mix problem.
Elite SaaS companies treat tracking SaaS metrics as a weekly discipline, not a quarterly exercise. They also invest heavily in SaaS expansion revenue because upsells and cross-sells carry zero acquisition cost and dramatically improve LTV:CAC ratios.

Pro Tip: If your NRR is above 110%, a longer payback period becomes much more tolerable. Strong retention buys you time. Weak retention accelerates every other problem.
Nuances for AI-driven and outcome-based SaaS models
If you’re building an AI-first product or experimenting with usage-based or outcome-based pricing, traditional unit economics benchmarks may actively mislead you.
AI-first SaaS gross margins average around 52%, compared to the 80% typical of traditional SaaS. Some early-stage AI products run as low as 25% gross margin during heavy inference cost phases. That’s a fundamentally different financial model, and applying traditional targets to it will produce the wrong conclusions.
| Model type | Gross margin range | Typical payback |
|---|---|---|
| Traditional SaaS | 75-85% | 12-20 months |
| AI-first SaaS | 50-70% | 20-30+ months |
| Usage-based SaaS | 60-75% | Variable |
| Outcome-based SaaS | 40-65% | Highly variable |
The gross margin in SaaS conversation changes when inference costs are a real line item. Every API call, every model query, every compute cycle adds to your COGS in ways that traditional software never did.
Pro Tip: Don’t benchmark your AI-first product against 80% gross margin targets. Set realistic interim targets at 55-65% and build a clear roadmap toward margin improvement as you optimize model efficiency and pricing.
Common missteps founders make with AI cost structures:
- Pricing based on perceived value without modeling inference costs per customer.
- Ignoring per-usage cost variability when heavy users can invert your unit economics.
- Assuming gross margins will improve automatically without actively optimizing model calls.
- Applying traditional LTV:CAC targets without adjusting for longer payback realities.
- Underestimating support and fine-tuning costs as part of COGS.
Outcome-based pricing introduces another layer of complexity. When you charge based on results delivered rather than seats or usage, your revenue recognition and cost timing can diverge significantly. That creates forecasting risk that traditional SaaS founders rarely face.
Applying unit economics: optimizing for growth and retention
Understanding your metrics is one thing. Improving them is where most founders get stuck.
Organic channels deliver 3x better economics than paid acquisition, yet most growth-stage companies still over-index on performance marketing when CAC starts climbing. The instinct to spend more to grow faster often makes unit economics worse, not better.
“The companies with the best unit economics in 2026 are not the ones spending the most on acquisition. They’re the ones investing in product-led growth, content, and community while obsessing over retention.”
Practical steps to improve your unit economics:
- Prioritize NRR above all else. Every percentage point of NRR improvement compounds. Audit churn reasons quarterly and build retention programs around the top three causes.
- Shift budget toward organic and product-led channels. Content, SEO, and in-product virality carry far lower CAC than paid social or outbound sales.
- Build expansion revenue into your product roadmap. Driving expansion revenue through upsells, add-ons, and tier upgrades improves LTV without touching acquisition costs.
- Enforce gross margin discipline. Review COGS monthly. Infrastructure bloat, excessive support tickets, and unoptimized third-party tools all erode margin silently.
- Reduce CAC payback through better onboarding. Faster time-to-value means faster payback. Invest in onboarding as a revenue function, not just a support function.
- Segment your unit economics by cohort. Averages hide problems. A cohort from a specific channel or segment may be dragging your overall LTV:CAC down significantly.
You can reduce CAC payback meaningfully by combining pricing optimization with onboarding improvements. It doesn’t always require a complete go-to-market overhaul. Monitoring your SaaS financial health indicators monthly keeps these levers visible and actionable.
Pro Tip: Before increasing your acquisition budget, ask whether your current customers are staying, expanding, and referring. If the answer is no, more acquisition will only accelerate your burn, not your growth.
The uncomfortable truth about SaaS unit economics
Here’s what we see consistently: founders celebrate growth while their unit economics quietly deteriorate. Revenue goes up, headcount grows, and the dashboard looks healthy until it doesn’t. Growth masks poor economics with remarkable efficiency, especially in AI-first models where margin compression is invisible until it becomes a crisis.
The founders who build durable companies treat strategic metrics as a weekly operating rhythm, not a fundraising exercise. They know their NRR to the decimal. They know which cohorts are dragging LTV:CAC down. They know their gross margin by product line, not just in aggregate.
Vanity metrics like total ARR or user counts feel good in board meetings. But seasoned operators measure success by value delivered per dollar spent and retained. That discipline separates companies that scale sustainably from those that grow fast and then restructure.
Build the habit of reviewing your unit economics dashboard weekly. What gets measured gets improved. What gets ignored becomes the reason your next fundraise is harder than it should be.
Build smarter SaaS economics with Meticq
Mastering unit economics requires more than knowing the formulas. It requires real-time visibility into the metrics that actually drive your decisions. That’s exactly what Meticq is built for.

Meticq automates the financial workflows that slow founders down, from SaaS bookkeeping to live metric dashboards that surface CAC, NRR, LTV, and payback period without manual data entry. You get SaaS financial dashboards built for growth-stage decisions, not just compliance. Whether you need a clearer picture of your current economics or a partner to help you improve them, Meticq gives you the CFO-level clarity to act with confidence. Start tracking SaaS metrics the way elite operators do.
Frequently asked questions
What are the most important unit economics metrics for SaaS founders?
The five metrics every growth-stage founder must track are CAC, Gross Margin, LTV:CAC, Payback Period, and NRR. 2025 benchmarks show elite companies achieving LTV:CAC of 3.6x and NRR above 100%.
How do AI-first SaaS models impact unit economics?
AI-driven SaaS models carry lower gross margins, typically 50 to 70%, and longer payback periods due to inference and compute costs. The average AI gross margin sits around 52%, far below the 80% traditional SaaS benchmark.
What CAC payback period is considered healthy for growth-stage SaaS?
A payback period under 18 months is the target for growth-stage companies, but the current median sits at 20 months, meaning most companies are operating slightly outside the healthy range.
Should founders prioritize expansion revenue or acquisition?
Expansion revenue and NRR should come first. Organic channels deliver 3x better economics than paid acquisition, and expansion revenue improves LTV without adding acquisition cost.